
“We can never insure one hundred percent of the population against one hundred percent of the hazards and vicissitudes of life, but we have tried to frame a law which will give some measure of protection to the average citizen and to his family against the loss of a job and against poverty-ridden old age.”
— President Franklin D. Roosevelt, signing statement, Social Security Act, August 14, 1935
“ The annual cost of the program is projected to exceed annual income in 2026 and remain higher throughout the 75-year projection period. Total cost began to be higher than total income in 2021. Social Security’s cost has exceeded its non-interest income since 2010.
“If Congress does not act, combined trust fund reserves are projected to be depleted in 2034. At that time, there would be sufficient income to pay 83 percent of scheduled benefits.”
— Social Security Trustees, 2026 Annual Report, May 2026
Social Security is not, in the public mind, typically described as a consumer protection program. It is described as a social insurance program, a retirement program, an entitlement. But evaluate it against the structural features that consumer protection law demands of financial products—transparency, guaranteed performance, protection against adverse selection, mandatory survivor benefits, inflation adjustment, and immunity from the individual decision-making failures that behavioral economics has documented—and Social Security turns out to be the most robustly consumer-protective retirement benefit in the American system. It is also now doing the work that three separate benefits programs—the pension, the retiree health benefit, and individual savings—were supposed to do together. This report documents how that happened, what it means for the financial security of older Americans, and why the long-deferred question of Social Security’s actuarial solvency has become, in the most direct sense, a consumer protection emergency. The data are clear. The political will is what has been lacking.
I. Social Security as a Consumer Financial Product
What would it cost you to buy what Social Security gives you? Consumer protection law evaluates financial products against a set of structural criteria: Does the product perform as represented? Is the consumer protected from risks they cannot evaluate? Are the terms clear and the consequences disclosed? Does the product structure protect against known behavioral failures—impulsivity, present bias, inadequate longevity planning? Social Security passes every one of those tests. Most private retirement products pass few of them.
Social Security meets every one of these criteria in ways that no private retirement product does at comparable scale and cost. Consider what my parents—now in their nineties—get from this program: a benefit that has gone up with inflation every year since my father retired in 1978, a survivor protection my mother will carry for the rest of her life, and no ability to cash it out in a moment of panic or temptation. That last feature is not a limitation. It is the most important consumer protection in the design.
- Guaranteed performance: Social Security pays a defined monthly benefit that does not fluctuate with market conditions. The consumer bears no investment risk.
- Inflation protection: Benefits are adjusted annually by the Consumer Price Index (COLA). Private annuities typically do not include inflation adjustment at equivalent price points; when they do, the cost is substantially higher.
- Longevity insurance: Benefits continue for the life of the recipient, regardless of how long they live. This is the core insurance function—protection against the risk of outliving one’s assets—that the voluntary savings system systematically fails to provide.
- Survivor protection: Spousal and survivor benefits are built into the structure. A surviving spouse receives the higher of their own benefit or their deceased spouse’s benefit. This protection is automatic; it does not require a separate purchase or a form to complete.
- Disability coverage: Social Security Disability Insurance (SSDI) protects workers against the income consequences of disability before retirement age—a risk that most private retirement accounts do not address.
- No cash-out option: Unlike a 401(k) or IRA, Social Security benefits cannot be accessed early and spent. The structure prevents the behavioral failure that drains $92 billion annually from the private retirement system. Behavioral research on the “annuity puzzle”—the well-documented tendency of individuals to undervalue guaranteed lifetime income relative to a lump sum they can see and touch—explains why this design feature is a feature, not a bug. When the cash-out option exists, it’s lure often overrides the long-term interest. Social Security’s designers understood this.
At 2026 annuity purchase rates, replicating the average Social Security benefit of $23,704 per year—inflation-adjusted, lifetime-guaranteed, with survivor benefits—from a private insurer would cost approximately $500,000 to $600,000 for a 65-year-old, depending on the survivor benefit structure. Social Security delivers this benefit to approximately 90 percent of Americans aged 65 and older through a payroll-financed system at a marginal cost that represents one of the most economically efficient income-replacement mechanisms ever designed. Most Americans take the program for grated. They should not.
II. How Social Security Became the Most Important Source of Retirement Income
The original conception of retirement security in America—articulated in the academic and policy literature of the 1960s and 1970s—rested on what became known as the three-legged stool: Social Security as the universal floor, private employer pensions as the supplemental income layer, and individual savings as the discretionary top-up. Each leg performed a distinct function; together, they were supposed to provide income replacement sufficient for a dignified retirement.
That structure has collapsed for the majority of Americans now entering retirement. The evidence is unambiguous:
The Pension Leg Has Largely Disappeared
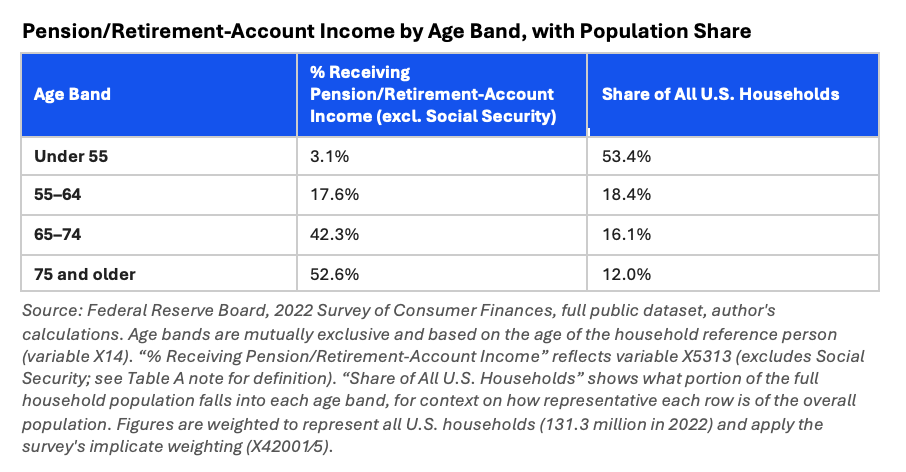
In 1974, 44 percent of private-sector workers participated in a defined benefit pension plan that would pay a guaranteed monthly income for life. By 2026, fewer than 9 percent do. The share of retirees aged 65 and older receiving private defined benefit pension income has fallen from 22.8 percent in 2002 to between 12 and 21 percent today (depending on survey and definition)—and that declining population consists primarily of workers who retired before 1990. For new retirees entering the system in 2026, private DB pension income is effectively unavailable. They have 401(k) accounts—if they were fortunate enough to work for an employer who sponsored one and were financially able to participate.
My father had a defined benefit plan, but when given the option of taking a lower benefit so that if he died before my mother ,she would keep getting the pension, they chose the higher benefit. Dad died three years before my mother, and for those last three years her only income was Social Security. The law requires that this choice be offered and explained, but many retirees make the decision my parents did, making the survivor’s reliance on Social Security even greater.
The median 401(k) balance among all current-employer participants at year-end 2023 was $15,448, generating approximately $45 per month in annuity income at 2026 rates. Even among the most financially engaged workers—those in their sixties with more than thirty years of continuous participation—average balances of approximately $312,000 produce approximately $910 per month.
These programs do not currently provide meaningful supplemental income above Social Security for the large majority of all retirees.
The Retiree Health Leg Has Nearly Vanished
The collapse of employer-sponsored retiree health coverage is the least-discussed but most consequential element of the three-legged stool’s disintegration. Among large employers (those with 200 or more employees), the share offering any retiree health benefits fell from 66 percent in 1988 to 24 percent in 2024. Among large employers still offering retiree health benefits to Medicare-age retirees specifically, the share was 21 percent in 2023, down from 29 percent in 2020. Among smaller employers, the share is negligible.
The practical consequence for older Americans is that healthcare costs—which the Employee Benefit Research Institute (EBRI) modeling has estimated could require $390,000 or more in dedicated savings for a 65-year-old couple with high drug costs, a figure likely conservative given subsequent cost escalation—must now be funded almost entirely from Social Security, 401(k) distributions, and personal savings. Annual family premiums for employer-sponsored health insurance reached $26,993 in 2025—a 170 percent increase from $9,950 in 2004, far exceeding wage growth and general inflation. For retirees on fixed incomes, this cost trajectory represents a direct threat to the adequacy of Social Security benefits that are otherwise sufficient.
The Savings Leg Has Never Reached Most Workers
Individual savings—the discretionary top-up in the three-legged stool model—was always the weakest leg for lower- and moderate-income workers. IRA ownership grew from 19 percent of individual workers in 2004 to 44 percent of households by mid-2024. But that growth has been driven primarily by rollovers from employer plans, not by direct contributions: only 16 percent of households contributed to IRAs in tax year 2023. 37 percent of U.S. adults said they would be “unable to cover a $400 emergency expense using cash or its equivalent”. Among adults with income under $50,000, 40% said they could not cover even a $100 emergency expense with cash on hand. For these workers, the concept of discretionary retirement savings above and beyond a 401(k) contribution is theoretical. (Federal Reserve Board, Report on the Economic Well-Being of U.S. Households in 2025 (May 2026), Savings and Investments section.)
III. The Importance of Social Security Income
The consequences of the three-legged stool’s collapse are visible in the income data for Americans aged 65 and older:
- Three in five Social Security beneficiaries aged 65 and older (60 percent) rely on Social Security for at least half of their income.
- Approximately one in five receives all of their income from Social Security.
- For the bottom 40 percent of the income distribution among older Americans, Social Security accounts for approximately 84 percent of total income.
- The share of the 65-and-older population without income from either a private or public defined benefit plan now exceeds 75 percent of new retirees.
- For those without defined benefit pension income, or public pension income, Social Security provides approximately 83 percent of total income at the median—essentially unchanged from the 2002 figure of 83 percent, despite twenty-two more years of 401(k) system growth.
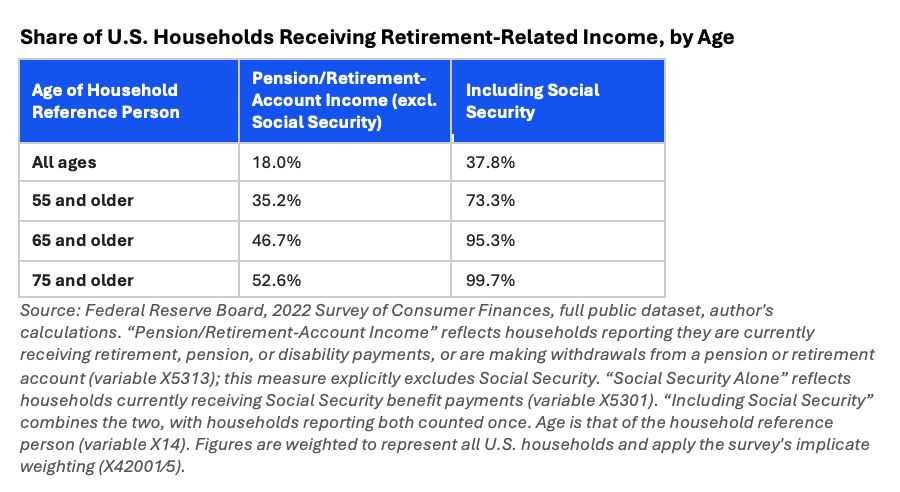
This last finding is the most revealing: after fifty-two years of the defined contribution system—after decades of 401(k) growth, IRA expansion, and tax incentives for individual retirement savings—Social Security’s share of income for the majority of retirees without traditional pensions has not declined. The Federal Reserve data presented above shows that the voluntary savings system has not supplemented Social Security for most workers in a significant way. It has, at best, preserved its relative position. For many workers, particularly those with lower incomes and interrupted employment histories, it has not even done that.
IV. The Value of What Social Security Provides
The economic value of Social Security benefits is systematically underappreciated—in part because the program’s design makes its insurance components invisible.
Consider what a retiree would need to purchase from the private market to replicate the package of benefits Social Security provides:
- A single-premium immediate annuity paying $1,976 per month ($23,712 per year, the 2024 average benefit) for life, with no inflation adjustment, would cost approximately $380,000 to $400,000 for a 65-year-old male at 2026 rates.
- Adding a COLA (inflation adjustment) comparable to Social Security’s CPI-based adjustment increases the cost to approximately $500,000 to $600,000.
- Adding survivor benefits—the right of a surviving spouse to receive the higher of their own benefit or their deceased spouse’s benefit—would add further cost in a private market product, if available at all.
- Social Security Disability Insurance protection for pre-retirement disability is not typically available through a standalone private annuity product.
Social Security delivers this entire package to 90 percent of older Americans at a payroll tax cost (6.2 percent of covered wages for employees, matched by employers) that represents a fraction of the private-market equivalent. The administrative efficiency of Social Security—administrative costs of less than 1 percent of benefits paid, compared to 10 to 20 percent for private life insurance products—makes it one of the most cost-effective financial products ever designed at scale.
V. The Actuarial Gap: A Consumer Protection Crisis
Social Security’s long-term actuarial imbalance has been known and documented for decades. The Social Security trustees project that under current law, the combined Old-Age and Survivors Insurance and Disability Insurance trust funds will be depleted by late 2032, at which point incoming payroll tax revenues would be sufficient to pay approximately 83 percent of scheduled benefits. This is not a crisis that requires fundamental restructuring—it is a funding gap that can be closed with relatively modest adjustments to the retirement age, the benefit formula, and the taxable wage base, or some combination of the three.
From a consumer protection standpoint, the failure to address Social Security’s actuarial imbalance is an active harm to the 90 percent of older Americans who depend on it. Workers who have paid into the system for their entire careers—who have earned their benefits through decades of payroll tax contributions—face the prospect of a benefit cut of 17 to 21 percent when the trust funds are depleted. The workers most harmed by such a cut would be those in the bottom 40 percent of the income distribution, for whom Social Security provides 84 percent of total income. A 20 percent cut in their Social Security benefit would be a 17 percent cut in their total income—from an already inadequate base.
Four additional hidden risks compound the picture and reinforce the urgency of Social Security preservation.
- First, the Medicare coverage gap: Part A deductibles, Part B’s 20 percent co-pay on physician fees with no stop-loss provision, and Part D prescription costs create potentially unlimited out-of-pocket exposure. One in seven Medicare beneficiaries lacks supplementary Medigap or employer coverage; without stop-loss protection, a serious chronic illness can devastate even a well-prepared retiree financially.
- Second, the Medicaid long-term care trap: a 78 percent probability that at least one spouse in a couple will need nursing home care, at costs exceeding $92,000 per year, combined with Medicaid asset tests requiring spend-down to $2,000 (individual) or $3,000 (couple) before coverage begins, can devastate middle-class households and leave the surviving spouse impoverished.
- Third, sequence-of-returns risk in private savings: even workers who preserve their 401(k) balances face permanent portfolio damage if an early-retirement market crash forces large liquidations at the bottom. Two portfolios with identical average returns over 25 years can diverge to total portfolio exhaustion depending on whether the crash falls in year one or year twenty.
- Fourth, the 2035 political deadline frames the Social Security funding shortfall as a political decision: absent structural reform, the system’s geometry will force a choice between a payroll tax increase of roughly 22 percent or a benefit cut of 17 percent at depletion—a mathematical certainty for younger workers absent Congressional action.
Taken together, these are the risks that Social Security’s guaranteed, inflation-adjusted, un-cashable structure addressed. Social Security is the only large-scale mechanism in the American retirement system specifically designed to address them simultaneously.
VI. What Should Be Done
1. Address the Actuarial Imbalance—Now, Not Later
The adjustments required to close Social Security’s long-term funding gap are known, modest relative to the program’s scale, and achievable without fundamental restructuring. Incremental increases in the full retirement age, adjustments to the benefit formula that preserve replacement rates for lower-income workers, and an increase in the taxable wage base (currently capped at $176,100 in 2025) are the primary available levers. The actuarial modeling has been done. The political will is what has been lacking. Given the scale of dependence on Social Security among older Americans—and the absence of adequate private-sector alternatives—this is no longer a deferred policy question. It is an active consumer protection emergency.
2. Protect Social Security’s Consumer-Protective Design Features
Any discussion of Social Security reform should be evaluated against the consumer protection features that make the program uniquely valuable: mandatory universal participation (preventing adverse selection), inflation adjustment (protecting against the purchasing power erosion that devastates fixed-income retirees), survivor benefits (protecting spouses who outlive the primary earner), and the prohibition on pre-retirement cash-out (preventing the behavioral failures that drain the private savings system). These features are not incidental to Social Security’s design; they are the reason it works. Reform proposals that eliminate or erode any of them should be evaluated as consumer protection rollbacks, not merely as program restructurings.
3. Strengthen the Private Supplement—but Do Not Confuse It With Social Security
The Saver’s Match (effective 2027), state auto-IRA programs, SECURE 2.0’s automatic enrollment mandate, Trump Accounts, and TrumpIRA.gov all represent genuine progress toward extending the reach of private retirement savings to uncovered and under-covered workers. These initiatives are valuable and should be aggressively implemented. But they should not be confused with Social Security, and they should not be offered as alternatives to addressing Social Security’s actuarial imbalance. A worker auto-enrolled in a state IRA program at a 3 percent default contribution rate, accumulating $15,000 over ten years of job changes, and cashing out half of it at each transition, will not have a private supplement adequate to compensate for a 20 percent Social Security benefit cut.
4. Tell People What They Have
Social Security’s most under appreciated consumer protection failure is informational: most Americans significantly underestimate the value of their Social Security benefit and significantly overestimate the adequacy of their private retirement savings. SSA’s annual Social Security Statement, available at ssa.gov/myaccount, provides projected benefit estimates that most workers have never reviewed. Financial literacy initiatives, employer benefit communications, and participant statements (as required by SECURE 2.0) should systematically place Social Security benefit projections alongside 401(k) account balances—so workers can see both components of their retirement income picture and understand the gap between what they have and what they need. But better disclosure alone will not close that gap. The behavioral research is consistent that even well-informed workers often fail to change savings behavior in response to information alone. Disclosure is necessary. It is not sufficient. The structural tools—automatic enrollment, automatic escalation, default annuitization—are what move the needle. Information helps people understand what the structure has already put in place for them.
5. Consider Creation of a National Commission to Preserve Social Security
Only Congress can take steps to preserve the Social Security system, but its members are discouraged from doing so by the fear that a political opponent will politicize the issue. Support for any change that raises the retirement age or increases Social Security taxes, for example, provides material for campaign ads. Back in 1981, when the system was running out of money, Congress wisely created a bipartisan National Commission on Social Security reform. This 15-person body included such notables as Alan Greenspan, Claude Pepper, Lane Kirkland, and Pat Moynihan. Its recommendations of necessity included taxing up to 50% of Social Security benefits, delaying COLA, raising the retirement age, and increasing Social Security taxes. But because of respect for this bipartisan commission, support from President Reagan, and the rapidly approaching exhaustion of the Social Security fund, Congress approved its recommendations. For the past 45 years, Social Security has essentially paid for itself. As a new funding crisis rapidly approaches, Congress should consider creating a similar commission with experts and leaders who are widely respected.
The last private bi-partisan Commission was at The Bipartisan Policy Center , which released its final, comprehensive report from the Commission on Retirement Security and Personal Savings on June 9, 2016. Co-chaired by former Senator Kent Conrad (D) and former Bush Administration Deputy Commissioner of Social Security (R) James B. Lockhart III, the landmark report outlined a package of bipartisan proposals aimed at addressing six key challenges, including expanding workplace retirement plan access and restoring long-term financial solvency to Social Security. Full disclosure. I was a member of this Commission.
VII. Conclusion
Social Security was not designed as a consumer protection program. It was designed as social insurance—a collective mechanism for managing the risks of old age, disability, and survivorship across the entire workforce. But evaluated against the criteria that consumer protection law applies to financial products, Social Security turns out to be the most robustly protective retirement benefit in the American system—more protective than any private pension, annuity, or savings account available at comparable cost. I have spent nearly fifty years studying the American retirement system. That is not a close call.
Social Security has become, for the majority of American retirees, not the floor of a three-legged stool but the entire load-bearing structure. (Seiter and Slavov, National Bureau of Economic Research, 2023; EBRI/Greenwald Retirement Confidence Survey, 2013 and 2025) The pension leg and the retiree health leg have effectively disappeared for new retirees. The individual savings leg reaches most workers inadequately and is subject to the behavioral failures—cash-outs, under diversification, poor distribution decisions—that private markets have proven unable to prevent through disclosure alone.
In this context, the failure to address Social Security’s long-term actuarial imbalance is not a fiscal policy deferral. It is an active and growing consumer protection harm, concentrated among the Americans with the least capacity to absorb it. The tools to close the gap are available. The cost is manageable. The actuarial modeling has been done. Few things would make me more concerned than watching Congress continue to defer this decision. Few things would make me happier than seeing it finally resolved.
The United States does not face a universal retirement “crisis” afflicting every retiree equally. The voluntary employer system and Social Security work reasonably well for a substantial fraction of older Americans—full-career, pensioned, home owning workers with predictable baseline expenses and intact dual Social Security claims. What the data document is a targeted systemic failure concentrated in specific, identifiable populations: the divorced and widowed who lose economies of scale and dual Social Security claims; the long-term disabled who face massive early asset depletion and interrupted accumulation; the unemployed older worker whose forced early retirement truncates peak earning and saving years; and the gig workers and non-participants who make up roughly 50 percent of the workforce without access to employer-sponsored accumulation mechanisms. These groups are systematically underrepresented in adequacy models that assume “median married full-career workers.” They are precisely the populations for whom Social Security is not one income source among several, but the entire structure. Protecting Social Security’s solvency, its consumer-protective design features, and its purchasing power is not a universal policy preference. It is a surgical intervention aimed at the Americans for whom the rest of the retirement system has already failed.
Primary Sources
Social Security Administration Data and Reports
Social Security Administration. Fast Facts & Figures About Social Security, 2024. SSA Publication No. 13-11785. https://www.ssa.gov/policy/docs/chartbooks/fast_facts. Primary source for average benefit levels, beneficiary counts, and income share data.
Social Security Administration. Income of the Aged Chartbook, 2022. SSA Publication No. 13-11727. https://www.ssa.gov/policy/docs/chartbooks/income_aged. Source for Social Security income share by income quintile; documents ~84% of income from Social Security for bottom 40% of older Americans.
Social Security and Medicare Boards of Trustees. 2026 Annual Report of the Board of Trustees of the Federal Old-Age and Survivors Insurance and Federal Disability Insurance Trust Funds. Washington, DC: SSA, 2024. https://www.ssa.gov/oact/tr. Source for trust fund depletion projections (2034) and post-depletion payment capacity (83 percent of scheduled benefits).
Social Security Administration. Annual Statistical Supplement to the Social Security Bulletin. Table 4.A1 (administrative costs as a share of benefit payments). https://www.ssa.gov/policy/docs/statcomps/supplement. Source for less-than-1-percent administrative cost ratio.
Pension and 401(k) System Data
U.S. Department of Labor, Employee Benefits Security Administration. Private Pension Plan Bulletin: Historical Tables and Graphs, 1975–2023. Washington, DC: DOL EBSA, September 2025. https://www.dol.gov/agencies/ebsa/researchers/statistics/retirement-bulletins.
EBRI / ICI 401(k) Database. Year-End 2023 Data Release. Source for median 401(k) balance ($15,448) and long-tenure worker average ($312,000). https://www.ebri.org and https://www.ici.org.
Pension Rights Center. Retirement Plan Coverage Data, 2024. https://www.pensionrights.org. Source for share of retirees aged 65+ receiving private DB annuity income.
Investment Company Institute (ICI). IRA Ownership and Contribution Data, 2024. https://www.ici.org. Source for 44 percent household IRA ownership and $17.0 trillion IRA assets at year-end 2024.
Retiree Health Coverage and Healthcare Costs
KFF (Kaiser Family Foundation). Employer Health Benefits Survey, 2023–2024. https://www.kff.org/health-costs/report/2024-employer-health-benefits-survey. Source for large-employer retiree health coverage (24% in 2024, down from 66% in 1988) and family premium levels ($26,993 in 2025).
Employee Benefit Research Institute (EBRI). Funding Savings Needed for Health Expenses for Persons Eligible for Medicare. EBRI Issue Brief (updated annually). Source for estimate that a 65-year-old couple with high drug costs may need $390,000 or more in dedicated healthcare savings. https://www.ebri.org.
American Council of Life Insurers (ACLI). Life Insurers Fact Book, 2024. https://www.acli.com. Source for private life insurance administrative expense ratios of 10–20 percent of premiums/benefits, compared to Social Security’s less-than-1-percent ratio.
Household Wealth, Hidden Risks, and Adequacy Studies
Board of Governors of the Federal Reserve System. Survey of Consumer Finances, 2022. https://www.federalreserve.gov/econres/scfindex.htm. Source for household net worth by age cohort and retirement asset distribution.
Hurd, Michael D. and Susann Rohwedder. “Economic Preparation for Retirement.” NBER Working Paper No. 17203. Cambridge, MA: National Bureau of Economic Research, July 2011. https://www.nber.org/papers/w17203. Uses actual post-retirement consumption data; finds 81% of households managing adequately.
Pfau, Wade D. “Sequence of Returns Risk in Retirement.” Journal of Financial Planning and related working papers. Documents how the order of returns determines portfolio longevity when withdrawals are active; early market crashes force outsized liquidations at the bottom, permanently destroying future compounding.
Elder Economic Security Standard™ Index (Elder Index / EESI). Gerontology Institute, University of Massachusetts Boston. Measures the actual cost of basic needs for older adults at approximately twice the Federal Poverty Level. https://elderindex.org.
Public Understanding of Social Security and Retirement Adequacy
Seiter, Grant M., and Sita Slavov. “Do Older Adults Accurately Forecast Their Social Security Benefits?” NBER Working Paper No. 31023. Cambridge, MA: National Bureau of Economic Research, March 2023. https://doi.org/10.3386/w31023. Source for finding that older adults underestimate their actual annual Social Security income by approximately $1,896 (11.5 percent) on average, using Health and Retirement Study panel data.
Chen, Anqi, Yimeng Yin, and Alicia H. Munnell. “How Well Do People Perceive Their Retirement Preparedness?” Issue in Brief 23-12. Chestnut Hill, MA: Center for Retirement Research at Boston College, 2023. https://crr.bc.edu. Source for the finding that self-reported retirement-income adequacy diverges sharply from the National Retirement Risk Index’s objective measure, with self-reported “inadequate” assessments falling from 57 percent (2013) to 34 percent (2019) even as the NRRI continued to show roughly half of households at risk.
Social Security Administration. “Workers’ Expectations About Their Future Social Security Benefits: How Realistic Are They?” Social Security Bulletin, vol. 81, no. 4. https://www.ssa.gov/policy/docs/ssb/v81n4/v81n4p1.html. SSA’s own 50-year (1971–2020) literature review of public survey data on benefit expectations, concluding that workers have substantially underestimated their future Social Security benefits across multiple decades of survey evidence.
Cato Institute and Morning Consult. 2025 Social Security Survey. Washington, DC: Cato Institute, August 2025. https://www.cato.org/survey-reports. Source for finding that only 25 percent of adults correctly identified the average annual Social Security benefit, while 38 percent underestimated it and 60 percent underestimated the maximum possible benefit.
Goldman Sachs Ayco. Retirement Reality Check. April 2026. https://www.goldmansachs.com/what-we-do/ayco/insights/retirement-reality-check. Source for finding that 68 percent of working respondents describe themselves as on or ahead of schedule for retirement, while 58 percent of the same respondents separately report believing they will outlive their savings.
Prudential Financial. 2025 Global Retirement Pulse Survey. October 2025. Source for finding that 89 percent of “mass affluent” Americans (age 30+, $100,000+ in investable assets) believe they will be able to cover essential retirement costs, despite most not having taken the concrete planning steps that would substantiate that confidence.
Helman, Ruth, Mathew Greenwald, Craig Copeland, and Jack VanDerhei. “The 2013 Retirement Confidence Survey: Perceived Savings Needs Outpace Reality for Many.” EBRI Issue Brief no. 384. Washington, DC: Employee Benefit Research Institute, March 2013. https://www.ebri.org. Source for the finding that workers’ perceived savings needs and reported confidence have diverged from their actual savings behavior and ability to cover basic, medical, and long-term care costs.
Copeland, Craig, and Lisa Greenwald. 2025 Retirement Confidence Survey. Washington, DC: Employee Benefit Research Institute and Greenwald Research, April 2025. https://www.ebri.org/retirement/retirement-confidence-survey. The longest-running survey of its kind (35th annual wave, n=2,767). Source for finding that 67 percent of workers and 78 percent of retirees report confidence in having enough money for a comfortable retirement, alongside a persistent, multi-decade gap between workers’ expected retirement age and retirees’ actual retirement age.
Legislation
Social Security Act, 42 U.S.C. §§ 401 et seq. The governing statute for the Old-Age, Survivors, and Disability Insurance program. Benefits determined by statutory formula tied to career earnings, indexed to CPI after commencement.
SECURE 2.0 Act of 2022, Pub. L. 117-328, § 321. Requires employer plan benefit statements to include a lifetime income projection translating current account balances into estimated monthly retirement income; not yet fully implemented as of June 2026.
One Big Beautiful Bill Act, Pub. L. 119-21 (enacted July 4, 2025), IRC § 530A (Trump Accounts). Tax-advantaged children’s savings accounts with a $1,000 federal seed deposit for children born 2025–2028.
TrumpIRA.gov Executive Order (April 30, 2026). Directs Treasury to establish a low-cost IRA marketplace for uncovered workers, integrated with the Saver’s Match.

