
Fifty-two years after the Employee Retirement Income Security Act was signed into law, the employer-sponsored retirement system has completed a structural transformation that no one explicitly chose and that the data indicate has not delivered retirement security for the majority of American workers. This paper, updated from a 2004 ABA symposium keynote, documents that transformation—the collapse of defined benefit pension coverage, the rise of the 401(k) system and its persistent adequacy gaps, the growing dependence of older Americans on Social Security, and the erosion of retiree health coverage. Read through a consumer protection lens, these are not merely policy outcomes: they represent a system in which tens of millions of workers have been shifted from a protective, risk-absorbing, structured-benefit system into an individual-responsibility model without equivalent disclosure, without equivalent consumer protections, and without equivalent design standards. The policy question is not whether the transformation occurred—it has. The question is whether the public interest requires stronger consumer protections at every remaining point of vulnerability.
I. ERISA and the Architecture of the Shift
ERISA marked a turning point for the employer-sponsored system. Pre-ERISA pension design generally focused on long-tenured workers at normal retirement age and sought to provide meaningful income replacement for life. ERISA standards—particularly those related to participation, vesting, joint and survivor benefits, and funding—moved the focus from the career retiree to accrual and entitlement for even short-service workers. This led to cost increases, and eventually to a conceptual “equality” of defined benefit plans (traditional pensions guaranteeing a fixed monthly payment for life, with investment risk borne by the employer) and defined contribution plans (401(k)-style accounts where the employee makes most contributions, bears all investment risk, and must manage distributions in retirement).
From a consumer protection standpoint, this equivalence was always illusory. A “traditional” defined benefit “pension” was a consumer product with built-in protections: guaranteed income regardless of market performance, automatic survivor benefits, no cash-out option at job change, and longevity insurance by design. A 401(k) plan is a savings account with tax advantages. Treating them as equivalent in law and policy—as “two ways to do retirement”—obscured the fundamental difference in consumer risk between the two structures. Workers were moved from one to the other, often without explicit choice and without disclosure of what they were giving up.
Plan design began to focus on employee account appreciation, portability, and the delivery of a termination lump sum. EBRI policy forum publications from the early 1980s tracked this change and the resistance to it by elder statesmen who were still focused on adequate income replacement. The resistance lost. By the mid-1990s, even unions were negotiating the revision of defined benefit plans and the addition of supplemental defined contribution plans. New “hybrid” “cash-balance” defined benefit plans added cash distribution options to what had largely been annuity only plans. The “ownership society” framing of the early 2000s elevated individual account ownership as a social good in itself—independent of whether those accounts actually produced adequate retirement income.
The Federal Government Followed and Led
In the mid-1980s, the federal government redesigned its own pension system for new employees, cutting the defined benefit formula and adding the Thrift Savings Plan—a voluntary 401(k)-type vehicle. It blessed a shift in benefit strategy from income replacement to expense management. The private sector followed. The Pension Protection Act of 2006 (Pub. L. 109-280) addressed some structural weaknesses. The SECURE Act of 2019 (Pub. L. 116-94) and SECURE 2.0 of 2022 (Pub. L. 117-328)—with over ninety provisions—represent the most significant legislative acknowledgment in fifty years that defaults, automaticity, and behavioral design matter: that the purely voluntary, purely choice-based model has not delivered.
II. The Status of the Private System: Then and Now
The trajectory documented in 2004 has continued without reversal. The table below tracks the full arc of the structural shift.
Table 1: Active Participants in Private Sector Retirement Plans
| Metric | 1975 (first DOL data year) | 2004 | 2023 |
| DB active participants | 27.2M (44% of private workers) | 20.8M (~19%) | 11.1M (~8%) |
| DC active participants | 11.2M (18%) | 61.3M (~56%) | 96.4M (~72%) |
| 401(k) participants | None (enacted 1978) | 53.1M (~44% of private workers; ICI revised method) | 81.6M (~61% of private workers) |
| 401(k) plan assets | — | ~$2.2 trillion | $7.9 trillion |
Sources: DOL EBSA Private Pension Plan Bulletin Historical Tables 1975–2023 (September 2025), Tables E7 and E19; ICI Research Perspective April 2026 (for the September 2025 asset figure); BLS Current Employment Statistics (CES), All Employees, Total Private (series CEU0500000001), annual averages. Note on the 1975 column: ERISA was signed into law in September 1974; the DOL EBSA Form 5500 data series begins with plan year 1975, which is the first year for which authoritative active participant counts are available. The 1974 column header used in earlier drafts of this paper has been corrected to 1975. Note on coverage percentages: the numerator is active participants in private-sector DB or DC plans as reported to the DOL; the denominator is private-sector payroll employment, measured as the annual average of BLS Current Employment Statistics (CES) All Employees, Total Private, not seasonally adjusted (series CEU0500000001): 62.3 million in 1975, 110.1 million in 2004, and 133.1 million in 2023. CES counts jobs on employer payrolls and excludes the self-employed, so the percentages are approximate measures of coverage. Government plans (federal, state, and local) and church plans are excluded from both numerator and denominator. Percentages therefore reflect private-sector coverage only and do not capture the roughly 20 million state and local government workers covered by public DB plans. DB and DC counts overlap because some workers participate in both types of plan, and 401(k) participants are a subset of DC participants. Note on the 2004 basis: DOL changed how active participants are counted beginning with the 2005 research file. Counts for 2004 and earlier exclude individuals who were not contributing and not entitled to benefits; counts from 2005 forward include individuals eligible to contribute to a 401(k)-type plan even if they are not contributing. To keep 2004 comparable with 2023, Table 1 uses DOL’s revised 2004 counts (row “2004r” in Tables E7 and E19): 61.3 million DC, 53.1 million 401(k)-type, and 20.8 million DB active participants. On the earlier basis DOL reported 52.2 million DC, 44.4 million 401(k)-type, and 20.6 million DB active participants, or roughly 47%, 40%, and 19% of private-sector payroll employment. The 2023 figure of 81.6 million active 401(k)-type participants represents ~61% of the 133.1 million private-sector jobs on CES payrolls. 401(k) plan assets: DOL Table E19 reports $2.19 trillion (2004) and $7.92 trillion (2023); ICI data through September 2025 indicate assets have grown to approximately $10 trillion.
Figure 1: Active Participants in Private Sector Pension Plans by Plan Type, 1975-2023 (millions)
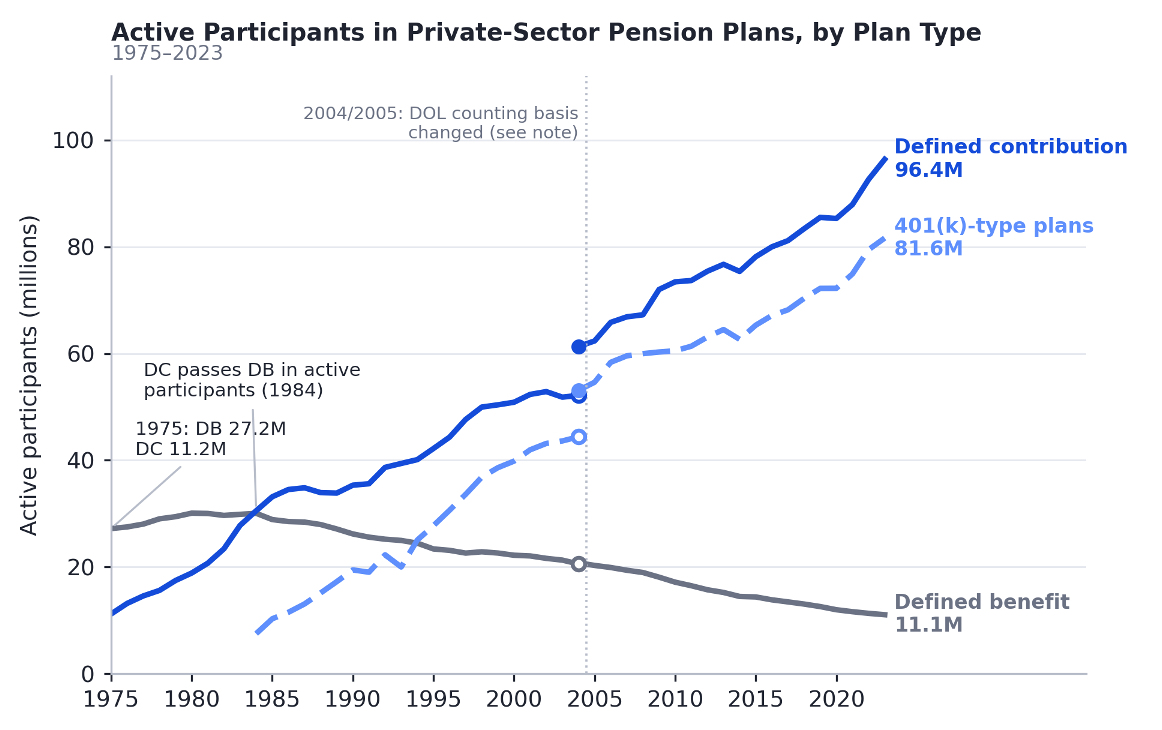
Source: U.S. DOL EBSA, Private Pension Plan Bulletin Historical Tables and Graphs 1975–2023 (September 2025), Tables E7 and E19. The break at 2004/2005 reflects DOL’s change in how active participants are counted (see notes to Table 1); hollow markers show 2004 on the earlier basis and filled markers show DOL’s revised 2004 count.
Between 1975 and 2023, active participants in private-sector defined benefit plans fell from 27.2 million (about 44 percent of private payroll jobs) to 11.1 million (about 8 percent), while active participants in defined contribution plans rose from 11.2 million (about 18 percent of private payroll jobs) to 96.4 million (about 72 percent of private payroll jobs), including 81.6 million in 401(k)-type plans. Defined contribution plans passed defined benefit plans in active participants in 1984 (Figure 1). One caution applies to the size of the defined contribution increase. Beginning with 2005 data, DOL counts workers who are eligible to contribute to a 401(k)-type plan as active participants even if they are not contributing; on that basis DOL’s revised 2004 count is 61.3 million, about 9 million above the 52.2 million published on the earlier basis. That definitional step accounts for about 11 percent of the 1975–2023 increase. The decline in defined benefit participation is essentially unaffected; the same change adds only about 0.2 million to the 2004 defined benefit count.
A methodological note is warranted. Institutional studies of retirement adequacy reach dramatically different conclusions depending on what they measure and how they define success—and those differences should be understood before citing any single headline figure. The National Institute on Retirement Security (NIRS) finds 92 percent of households falling short of retirement savings targets, but this finding uses account balances alone, excludes home equity, and applies high net-worth replacement targets. The Center for Retirement Research at Boston College’s National Retirement Risk Index (NRRI) finds 50 percent at risk, using a deterministic replacement ratio model that assumes constant pre-retirement lifestyle with no household downsizing. Aon Hewitt and EBRI, using stochastic cash-flow simulations that model investment shocks and include full-career employer plans, find roughly 40 percent failing and 60 percent secure. Hurd and Rohwedder (RAND), using actual post-retirement consumption data rather than pre-retirement income targets, find 81 percent managing adequately. These are not contradictory findings about different facts; they are different answers to different questions about different populations measured with different tools.
The verdict—crisis or success—depends largely on the diagnostic lens. A further methodological note is relevant to the adequacy targets used: static replacement ratio models assume workers must maintain their exact pre-retirement lifestyle in retirement at 70 to 85 percent of final salary. Consumption smoothing research, drawing on actual survey data of what retirees spend, consistently shows that spending naturally declines with age and reduced mobility. Household equivalence scale research formalizes this: when children leave, a couple’s budget can shrink by roughly 33 percent without any actual decline in their standard of living. Models using static replacement ratios therefore overstate required capital for many households relative to what they actually need. This paper uses the EBRI stochastic modeling framework and a consumer protection lens: the relevant question is not whether the median worker is broadly on track, but whether identifiable and preventable consumer protection failures are concentrating harm in specific populations.
Account Balances: What Accumulation Actually Produces
Twenty-two years after the 2004 paper, the picture is larger in nominal terms but structurally unchanged. The EBRI/ICI 401(k) database at year-end 2023 shows a median account balance of $15,448 among all current-employer participants—enough to purchase approximately $45 per month in lifetime annuity income at 2026 rates. That is less than a weekly grocery trip for most households. Workers in their sixties with more than thirty years of continuous participation average approximately $312,000—enough to purchase approximately $910 per month. (The EBRI/ICI database reports the mean for this long-tenure cohort; a separate median for workers in their sixties with 30+ years of continuous participation was not published in the 2023 database release. The mean figure is used here and is likely pulled upward by high-balance outliers, meaning median outcomes for this group are probably lower.) The gap between the median ($45/month) and a dignified retirement income ($2,000+/month) has not closed in twenty-two years.
From a consumer protection standpoint, this is both a disclosure problem and a savings problem. Workers in 401(k) plans are not routinely told, in plain language, how much monthly income their current balance would generate in retirement. SECURE 2.0 requires lifetime income projections on participant benefit statements—a step in the right direction that has not yet been fully implemented. The gap between what workers believe they are accumulating and what their balance will actually produce in monthly retirement income is one of the most consequential information failures in the consumer financial system. That said, disclosure alone is unlikely to be sufficient: behavioral research consistently finds that even well-informed workers often fail to change savings or distribution behavior in response to income projection disclosures alone. Disclosure is a necessary but not sufficient condition for improved retirement outcomes. The evidence base supports pairing disclosure mandates with structural defaults—automatic escalation, automatic rollover preservation, and annuity defaults—that make adequate behavior the path of least resistance rather than a product of individual initiative.
IRA Ownership: Growth With Persistent Gaps
By mid-2024, 44 percent of U.S. households owned IRAs, up from 19 percent of individual workers in 2004. IRA assets totaled $17.0 trillion at year-end 2024. But the growth has been driven primarily by rollovers from employer plans, not by direct contributions: only 16 percent of households contributed to IRAs in tax year 2023. The workers who most need supplemental savings—lower-income, small-employer, part-time, gig—remain the least likely to have them.
A specific consumer harm attaches to IRA rollovers: when workers roll their 401(k) balances into retail IRAs at job change, they typically move from institutional-class investment options (expense ratios of 3–10 basis points in large plans) to retail-class options (expense ratios of 50–100+ basis points). Over a 20-year accumulation period, this fee differential compounds into a significant reduction in retirement wealth—one that workers are not informed of at the point of the rollover decision.
III. The Consumer Protection Failures in the Shift
The structural transformation from defined benefit pensions to defined contribution accounts was not simply a change in retirement plan design. It was a transfer of risk—investment risk, longevity risk, inflation risk, and decision risk—from employers and insurers to individual workers. In any other consumer financial context, such a transfer of risk would trigger disclosure requirements, best interest standards, and structural protections. In the retirement context, it did not. The result is a system in which tens of millions of workers bear risks they do not fully understand, make decisions for which they are not equipped, and face consequences that are irreversible.
The Lump-Sum Distribution Problem
ERISA’s acceleration of the DC system created the lump-sum distribution as the dominant form of retirement benefit delivery. Workers who change jobs face a decision—roll over, cash out, or leave in the plan—at the moment of maximum financial stress, without neutral guidance, and with a legally required disclosure (the 402(f) special tax notice, IRC § 402(f)) that the GAO found in 2024 (GAO-24-107167) to be routinely too complex for the workers it is supposed to protect.
The behavioral results are well-documented and stark. Alight Solutions found that 80 percent of workers with balances under $1,000 cash out at job separation; EBRI estimates $92.4 billion leaves the retirement system annually through cash-outs. Each cash-out is a consumer harm: a $5,000 cash-out at age 30 represents approximately $38,000 in lost retirement wealth at age 65 (assuming a 35-year accumulation horizon, a 6% nominal annual return, and no reinvestment of tax savings; the figure is before tax-deferred compounding benefits and does not account for investment fees). Workers are not told this. The 402(f) notice does not say it. No one at the point of decision is required to say it. Improving the 402(f) disclosure is warranted and overdue, as the GAO has recommended (GAO-24-107167). At the same time, the behavioral literature cautions that improved disclosure at a moment of financial stress is unlikely by itself to reverse cash-out decisions: the behavioral pull of immediate liquidity is strong, and the long-term cost is abstract. Structural interventions—automatic rollover into a safe harbor IRA, plan-level portability, and friction on cash-out elections—have stronger evidence behind them than disclosure reform alone. One additional risk deserves acknowledgment even for workers who preserve their savings through a rollover: sequence-of-returns risk. When a retiree is actively withdrawing from a portfolio, the order of investment returns matters as much as the average return. An early market crash forces liquidation of outsized portions of the portfolio at the bottom, permanently destroying future compounding. Two portfolios with identical 25-year average returns can produce dramatically different outcomes depending on whether the crash comes early or late in retirement. This is the hidden vulnerability even of workers who do the right thing and roll over: a rollover does not eliminate market risk, and no one at the point of distribution is required to explain this either. It reinforces the consumer protection case for annuitization and for Social Security preservation as the only structures that fully eliminate sequence-of-returns risk through guaranteed lifetime income.
The Annuity Default Inversion
ERISA blessed the lump-sum distribution as an equivalent alternative to the annuity in defined benefit plans. The practical consequence—documented by EBRI’s 2013 analysis of DB plan behavior—is that when lump sums are freely available, annuitization rates fall from near 100 percent to 27 percent. When they are not available, nearly everyone annuitizes. The preference for lump sums is observed consistently when choice is available—but whether this reflects a genuine, considered preference or a predictable behavioral response to the structure of the choice is a different question, and one that behavioral economics has largely answered. A substantial body of behavioral research—including foundational work by Thaler and Sunstein, Benartzi and Thaler, and the annuity puzzle literature pioneered by Yaari (1965) and extended by Brown, Mitchell, Poterba, and Warshawsky—has documented that the demand for lump sums over annuities is driven in significant part by a bias toward immediate gratification (present bias), loss aversion applied to the prospect of dying “early” and leaving an annuity unpaid, and the psychological salience of a large visible lump sum relative to an abstract stream of future income. This is the “annuity puzzle”: people systematically undervalue guaranteed lifetime income relative to its actuarial worth, even when the annuity would clearly serve their long-run interest. The preference for lump sums, in other words, is real—but it is a behavioral preference, not a welfare-maximizing one. When workers are not offered a lump sum, they are not demonstrably worse off for the absence of the choice; they annuitize, and research on DB retirees indicates high levels of satisfaction with that outcome.
This is the central finding of fifty-two years of retirement research: the structure of the choice determines the outcome far more than the content of the choice. Workers are not choosing lump sums because they have rationally weighed the options. The behavioral research is clear on this—present bias pulls people toward the immediate and tangible; loss aversion makes the risk of dying “before getting their money back” feel more real than the risk of outliving their savings; and a large number in hand today simply feels more certain than a monthly check for life. These are predictable human tendencies, not evidence of informed preference. The lump sum is also the path of least resistance in the transaction itself—no one is legally required to quantify what the worker is giving up or to show what the annuity alternative would actually produce per month. The annual lifetime income illustration required under the SECURE Act of 2019 (Pub. L. 116–94, § 203; ERISA § 105(a)(2)(D)) is the closest existing analogue, but it is not a point-of-distribution disclosure: it is delivered on a benefit statement up to twelve months before the decision, uses standardized assumptions rather than the plan’s actual distribution options, and is silent on what cashing out specifically would forgo. A best interest standard at the point of distribution would require exactly that. The annuity puzzle would not disappear, but workers would at least face the choice with the full picture in front of them.
Let me offer a data point closer to home. In the 2004 version of this paper, I noted that my parents—both of whom had worked near the Social Security wage cap—were approaching 88 and 91, with a monthly defined benefit payment adding about one-third the value of Social Security on top of a benefit that was already as good as it gets. Both parents have since died, at 93 years and 10 months of age. They were in retirement for roughly 46 years. The defined benefit annuity did not run out. Social Security, inflation-adjusted every year, did not run out. The profit-sharing lump sum they had taken decades earlier was gone long before they were. The home was eventually sold. What kept them solvent for nearly half a century of retirement was the annuitized income they could not outlive and could not cash out—the structure they had not chosen, but that had been chosen for them by plan design. That is the annuity puzzle in reverse: the workers who were not given the lump-sum option did not suffer for the absence of it. They survived it.
Retiree Health Coverage: The Invisible Erosion
The collapse of employer-sponsored retiree health coverage—from 66 percent of large employers offering some coverage in 1988 to 24 percent in 2024—represents a consumer harm of the first order that has received far less attention than it deserves. Workers who planned their retirement finances around an expectation of employer-provided retiree health coverage—often based on plan communications that described but did not guarantee such coverage—have found that expectation violated, frequently without legal recourse.
The Supreme Court’s 2015 decision in M&G Polymers USA, LLC v. Tackett established that retiree health benefits are not automatically vested for life and must be specifically negotiated as such in collective bargaining agreements. The practical effect: most retiree health promises were not legally binding, and most workers did not know it. The workers now approaching retirement without the retiree health coverage they expected are bearing an uncompensated risk transfer that occurred without adequate disclosure. It is fair to acknowledge that disclosure in this context would not have given most workers the ability to change their outcome: retiree health coverage is an employer decision, and individual workers have little leverage to negotiate binding vested benefits. But disclosure would at least have enabled workers to plan more honestly—to purchase supplemental coverage, build larger retirement savings, or delay retirement—rather than operating under expectations that turned out to have no legal foundation. The consumer protection failure here is not only that workers were not warned; it is that the system provided no mechanism to make good on the implied promise once the employer withdrew it.
IV. The Income Picture for Older Americans: Updated Data
The 2004 paper presented income data for Americans aged 65 and older. The updated picture—drawn from SSA, the Federal Reserve SCF, Census SIPP, and KFF survey data—confirms the structural dependence on Social Security and documents the continuing decline of private pension and retiree health coverage. Table 2 now includes a 1962 baseline column, drawn from SSA’s 1963 Survey of the Aged and the SSA Income of the Population 55 or Older series, to show the full arc of change: in 1962, only 9 percent of aged units (the Social Security Administration’s term for a nonmarried person 65 or older, or a married couple living together with at least one spouse 65 or older, counted as a single unit) received any private pension income and only 69 percent received Social Security. By 2004, private pension receipt had tripled to 29 percent and Social Security coverage had reached 89 percent—reflecting the maturing of both systems over forty years. The 2022 data then show the beginning of the private pension reversal, as pre-1990 DB retirees age out and are not replaced by new cohorts with equivalent coverage. A methodological note is essential for the pension income row: the 2004 figure is private-sector pensions only (from the SSA Income of the Population 55 or Older series, which reported private and government pensions as separate line items); the 2022 figure is from the Census SIPP, which combines public and private pensions and is therefore not directly comparable. See the table footnote for detail.
Table 2: Income and Assets of Americans Aged 65+: ~1962 Baseline vs. 2002–2004 vs. 2022–2024
| Indicator | ~1962 Baseline | 2002–2004 | 2022–2024 |
| Private DB annuity income (% of 65+) | 9% of aged units (SSA Survey of the Aged, 1963); tripled to 29% by 2004 | 29% of aged units received private pensions (SSA Income of Pop. 55+, 2004); government pensions reported separately at 14%. Note: the 29% is private-sector pensions only. | 26% of adults 65+ received pension income (Census SIPP 2022)—but this figure combines public and private pensions. Private-sector DB pension receipt only: est. ~19–21% (SSA series discontinued after 2014; no published public/private split in SIPP). Trend is declining as pre-1990 DB retirees age out. |
| Employer retiree health coverage (large employers) | Data not systematically collected pre-1980; large-employer coverage estimated 30–40% by early 1960s surveys | ~34% in 2002 (down from 66% in 1988) | 24% of large employers; down from 66% in 1988 |
| Social Security: % of 65+ receiving | 69% (SSA Survey of the Aged, 1962) | ~90% | ~90% (essentially unchanged) |
| SS: share with 50%+ of income from SS | Data not available in comparable form; SS was primary income source for majority even then | ~2/3 of beneficiaries | 3 in 5 beneficiaries (60%) |
| Average annual SS benefit | ~$1,200/yr (~$100/mo, 1962 average retired worker benefit) | ~$11,880/yr ($990/mo) | $23,704/yr (2024); median $20,520/yr |
| Median retirement account balances, 65+ | IRAs and 401(k)s did not exist; DB pension wealth not separately measured in household surveys | $51,000 financial assets (2002) | $86,900 (2022 SCF, DC + IRA combined) |
| Median net worth, households 65–74 | ~$30,000 (est., 1962 SCF equivalent; primarily home equity; in 1962 dollars) | ~$240,000 (2001 SCF) | $409,900 (2022 SCF, 2022 dollars) |
Sources: SSA Fast Facts 2006 (for 1962 data); SSA, The Aged Population of the United States: The 1963 Social Security Survey of the Aged (for 1962 baseline); SSA Fast Facts 2024; SSA Income of the Population 55 or Older, 2004; Census Bureau Survey of Income and Program Participation (SIPP), 2022 data (released January 2025); Pension Rights Center 2024; KFF Employer Health Benefits Surveys 2023–2024; Federal Reserve SCF 2022; SSA Income of the Aged Chartbook. Note on the 1962 baseline column: figures are drawn from SSA’s 1963 Survey of the Aged (the first national survey of its kind) and the SSA Fast Facts & Figures chartbook series which published the 1962-to-2004 comparison. Where 1962 data are not available in comparable form, the cell states so explicitly. Note on percentage figures: for rows reporting percentages of Americans aged 65+, the denominator is the total noninstitutionalized civilian population aged 65 and over (U.S. Census/SSA); the numerator is the number of persons in that population receiving the indicated benefit or coverage. For the employer retiree health coverage rows, the denominator is large employers (200+ workers) surveyed by KFF; the numerator is those offering any retiree health benefit. These denominators differ across rows and are not directly comparable to one another. Critical methodological note on the pension row: the 2002–2004 figure (29%) is private pensions only, drawn from the SSA Income of the Population 55 or Older series, which reported private and government pensions as separate line items (government pensions: 14% in 2004). The 2022 figure (26%) is drawn from the Census SIPP, which combines private and government pensions in a single “pension income” category and excludes Social Security as a separate government program. These two figures are not directly comparable: the 2004 number is private-sector only; the 2022 number is public plus private combined. The SSA series that maintained this distinction was discontinued after the 2014 edition. Estimated private-sector-only pension receipt for 2022, derived from SIPP microdata trends and the known public-sector share, is approximately 19–21%. The 1962 figure of 9% is private pensions only (consistent with the SSA series definition for that year). Note on the employer retiree health coverage row, 2002–2004 column: the 34% figure (corrected from an earlier draft figure that was inconsistent with the rest of the row) is sourced to Kaiser/HRET and HIAA survey data as reported in Employee Benefit Research Institute, “Health Insurance Coverage in Retirement: The Erosion of Retiree Income Security” (citing the 1988 HIAA survey and the 2002 Kaiser/HRET survey), consistent with the well-documented decline from 66% in 1988 to 24% in 2024 reported by KFF.
Social Security: The Consumer-Protective Floor
In 2024, retired workers received an average of $23,704 per year ($1,976/month) in Social Security benefits. Three in five beneficiaries aged 65 and older relied on Social Security for at least half of their income; approximately one in five received all of their income from Social Security. Nine in ten people aged 65 and older received benefits.
What has changed since 2004 is that Social Security has grown more valuable in real terms relative to private alternatives, precisely because private alternatives have eroded. The average annual benefit of $23,704 would cost approximately $500,000 to $600,000 to replicate from a private insurer at 2026 annuity rates—accounting for the inflation adjustment (COLA) that private annuities typically do not include at equivalent price points. Social Security delivers this income to 90 percent of older Americans through a program that is, by design, fully annuitized, inflation-adjusted, survivor-protected, and uncashable. It is, in structural terms, the last large-scale consumer-protective retirement benefit in the American system. Social Security is doing more of the work with less private-sector support beneath it.
The Wealth Concentration Problem
The median net worth of households aged 65 to 74 reached $409,900 in 2022 (SCF, 2022 dollars), reflecting primarily home equity appreciation. But this figure conceals extreme concentration: the bottom quartile of older households—those with incomes below $25,000—had a 25th-percentile net worth of only approximately $15,000 after accounting for liabilities. The wealth of the median obscures the poverty of the bottom quartile. From a consumer protection standpoint, the appropriate focus is the population with $15,000 in net worth at age 65—entirely dependent on Social Security, with no margin for health expenses, home repair, or the financial shocks that accompany aging.
V. New Legislative Developments: Progress and Gaps
The period since 2004 has produced the most active legislative reform of the retirement coverage gap since ERISA itself. Four developments merit specific attention from a consumer protection standpoint.
The Saver’s Match (SECURE 2.0, effective January 1, 2027)
SECURE 2.0 converts the Saver’s Credit—which provided no benefit to the lowest-income workers who owed no federal income taxes—into the Saver’s Match: a direct federal deposit of up to $1,000 per individual into a qualifying retirement account, reaching workers who were systematically excluded from the prior credit structure. Pew estimates 22 million Americans will qualify. Morningstar projects $2.03 trillion in incremental 40-year savings benefit. This is the correct consumer protection design: it reaches the workers who need it most, rather than those already engaged in tax planning.
State Auto-IRA Programs
Beginning with Oregon in 2017, 15 to 18 states have enacted mandatory auto-IRA programs requiring employers without their own plans to automatically enroll workers in state-facilitated Roth IRAs. Over one million workers are enrolled with more than $2.75 billion in assets. The auto-IRA model—default enrollment, low fees, portability, no employer cost—is the direct application of behavioral consumer protection principles to the coverage gap: make the right choice the default, require affirmative action to opt out.
Trump Accounts (IRC § 530A, effective July 4, 2026)
The One Big Beautiful Bill Act (Pub. L. 119-21, enacted July 4, 2025) created Trump Accounts: tax-advantaged savings vehicles for children under 18, with after-tax contributions up to $5,000 annually, a $1,000 federal seed deposit for children born 2025–2028, and investment restricted to diversified U.S. stock index funds. The consumer protection concern is the same as with all voluntary savings programs: without automatic enrollment, participation will be concentrated among families already engaged in financial planning, not among the lower-income children the seed deposit is designed to reach.
TrumpIRA.gov (Executive Order, April 30, 2026)
The TrumpIRA.gov executive order directs Treasury to establish a marketplace of low-cost IRA options (expense ratios capped at 0.15%) for workers without employer plans, integrated with the Saver’s Match. The model is explicitly the Thrift Savings Plan. The consumer protection gap is the mechanism: a voluntary website enrollment will not reach the uncovered workers who most need it. AARP’s response—“a step in the right direction” with emphasis on the need for automatic enrollment through payroll deductions—correctly identifies the structural insufficiency. A low-cost option that requires active enrollment will be used primarily by workers already motivated to save.
VI. A Normative Observation: The Consumer Protection Case for Structural Accountability
I should be clear about what this section is. The preceding sections describe what fifty-two years of data show. This section describes what I believe those data require. They are not the same statement, and I have tried to keep them separate throughout this paper. What follows is normative. I would paint a very different picture of the retirement system than the one the data present—and I am going to say so directly before making the case for what should change. Let me be direct about what the data show. When workers are given an unconstrained choice between a lump sum and a lifetime annuity, they choose the lump sum. When lower-income workers face a voluntary participation decision, they disproportionately choose not to participate unless automatically enrolled. When workers control their own distribution speed, they rarely calibrate correctly for actual longevity. I noted these patterns in 2004. The data since have only reinforced them. But the right question is not whether the patterns exist—they do—it is what they say about accountability. These are not failures of individual rationality. They are the predictable result of a system that, without any apparent conscious collective choice, moved from one built on fixed promises and professionally managed assets to one where workers are expected to make all the decisions and bear all the consequences—while employers, financial intermediaries, and the tax-preferred plan structure continue to generate fees and subsidies regardless of participant outcomes. Workers did not choose this system. It is increasingly all that is on offer to them. The policy response cannot start and end with worker obligation.
Ask yourself this: in credit markets, mortgage markets, insurance, and securities, consumer protection law responds to the complexity of the product with disclosure mandates, cooling-off periods, and best interest standards. The retirement system has been largely exempt from that framework. It should not be. A best interest standard—requiring that those who advise workers at points of distribution or rollover act in the worker’s demonstrable financial interest—is not a radical intervention. It is already the law for securities advice under the SEC’s Regulation Best Interest (17 C.F.R. § 240.15l-1). DOL has sought, with varying success across administrations, to extend it to retirement plan rollovers. Applying it consistently and durably to the retirement distribution context is the most consequential single step available within the existing statutory framework. The data support it. The tools exist. The question is whether the political will to use them follows.
A final analytical point belongs in any normative assessment: the United States does not face a single, uniform retirement crisis. The voluntary employer system and Social Security base work reasonably well for a substantial fraction of workers—specifically, full-career workers with continuous employer-sponsored plan participation, home ownership, and predictable baseline expenses. The data are more accurately read as documenting a targeted systemic failure concentrated in specific, identifiable populations. At least four distinct groups face categorically different risk profiles. “The Haves”—full-career, pensioned, homeowning workers—are largely secure. “Asset-rich, shock-exposed” workers—high net worth but with heavy healthcare liability and sequence-of-returns exposure in retirement—face risks that their balance sheets do not obviously reflect. “Base-dependent” workers—low private savings but low shock exposure, relying on Social Security as their primary income source—are fragile but stable unless Social Security is cut. And “the have-nots and precarious middle”—single workers, renters, those with high health risk, interrupted employment histories, gig workers, divorced or widowed individuals who lost economies of scale and dual Social Security claims, long-term disabled workers whose asset accumulation was interrupted—face genuine inadequacy that the system as currently structured will not resolve. The policy implication is not panic; it is surgical intervention targeted at the populations where the math actually breaks down. The consumer protection failures documented in this paper—the 402(f) notice, the absence of a best interest standard, the safe-harbor IRA quality gap, the annuity default inversion—concentrate their harm precisely in this last quadrant. That is where the policy tools should be aimed.
The ambition of ERISA—extending the protective structure of guaranteed income, professional asset management, and risk-pooling to a broader population of American workers—has not been realized. I would paint a very different picture than the one the data present. Few things would make me happier than to see these trends reversed. I do not yet see that happening. But the consumer protection tools to act exist. The question remains what it was in 2004: whether the political will to use them will follow.
Primary Sources
Legislation and Regulation
Employee Retirement Income Security Act of 1974 (ERISA), Pub. L. 93-406. The foundational statute establishing minimum standards for private-sector pension and welfare benefit plans.
Tax Reform Act of 1978, Pub. L. 95-600, § 135 (enacting IRC § 401(k)). Created the legal basis for salary-deferral defined contribution plans.
Unemployment Compensation Amendments of 1992, Pub. L. 102-318 (codified at IRC § 401(a)(31) and § 402(f)). Established the 402(f) special tax notice requirement and mandatory withholding on eligible rollover distributions.
Pension Protection Act of 2006, Pub. L. 109-280. Addressed automatic enrollment, qualified default investment alternatives, and defined benefit funding requirements.
SECURE 2.0 Act of 2022, Pub. L. 117-328, Div. T. Key provisions: automatic enrollment for new 401(k) plans (§ 101); pension-linked emergency savings accounts/PLESAs (§ 127); auto-portability (§ 120); force-out threshold increase to $7,000 (§ 304); Saver’s Match (§ 103, effective January 1, 2027); lifetime income projections for participant statements (§ 321).
One Big Beautiful Bill Act, Pub. L. 119-21 (enacted July 4, 2025), IRC § 530A (Trump Accounts). Tax-advantaged accounts for minors with a $1,000 federal seed deposit for children born 2025–2028.
TrumpIRA.gov Executive Order (April 30, 2026). Directed Treasury to establish a low-cost IRA marketplace integrated with the Saver’s Match for uncovered workers.
M&G Polymers USA, LLC v. Tackett, 574 U.S. 427 (2015). Supreme Court decision establishing that retiree health benefits are not automatically vested for life without specific contractual language.
SEC Regulation Best Interest, 17 C.F.R. § 240.15l-1 (effective June 30, 2020). Establishes a best interest standard of conduct for broker-dealers making recommendations to retail customers.
Government Data and Reports
U.S. Department of Labor, Employee Benefits Security Administration. Private Pension Plan Bulletin: Historical Tables and Graphs, 1975–2023. Washington, DC: DOL EBSA, September 2025. Source for Table 1 and Figure 1 (Tables E7 and E19). https://www.dol.gov/agencies/ebsa/researchers/statistics/retirement-bulletins
U.S. Bureau of Labor Statistics. Current Employment Statistics (CES), All Employees, Total Private, not seasonally adjusted, annual averages (series CEU0500000001): 62,250 thousand (1975), 110,148 thousand (2004), and 133,074 thousand (2023). Denominator for the private-sector coverage percentages in Table 1. https://data.bls.gov/timeseries/CEU0500000001 (data retrieved September 28, 2026); program information at https://www.bls.gov/ces/.
U.S. Government Accountability Office. “Retirement Savings: Additional Data and Analysis Could Provide Insight into Early Withdrawals.” GAO-19-179. Washington, DC: GAO, April 2019. https://www.gao.gov/products/gao-19-179.
U.S. Government Accountability Office. “401(k) Retirement Plan Tax Notices.” GAO-24-107167. Washington, DC: GAO, May 2024. https://www.gao.gov/products/gao-24-107167.
Social Security Administration. The Aged Population of the United States: The 1963 Social Security Survey of the Aged. SSA Research Report No. 19. Washington, DC: SSA, 1963. Primary source for 1962 baseline data on income sources of the aged population, including the 9% private pension receipt figure.
Social Security Administration. Fast Facts & Figures About Social Security, 2006. SSA Publication No. 13-11785. https://www.ssa.gov/policy/docs/chartbooks/fast_facts/2006. Source for the 1962-to-2004 comparison of income receipt by source among aged units, including private pensions (9% in 1962, 29% in 2004) and government pensions (9% in 1962, 14% in 2004).
Social Security Administration. Income of the Aged Chartbook, 2022. SSA Publication No. 13-11727. https://www.ssa.gov/policy/docs/chartbooks/income_aged.
Board of Governors of the Federal Reserve System. Survey of Consumer Finances, 2022. https://www.federalreserve.gov/econres/scfindex.htm.
Industry and Academic Research
Employee Benefit Research Institute (EBRI). “Annuity and Lump-Sum Decisions in Defined Benefit Plans: The Role of Plan Rules.” EBRI Issue Brief No. 381. Washington, DC: EBRI, January 2013. Documents annuitization rates of ~100% when lump sums are unavailable, falling to 27.3% when freely offered.
Employee Benefit Research Institute (EBRI). “The Impact of Auto Portability on Preserving Retirement Savings Currently Lost to 401(k) Cashout Leakage.” EBRI Issue Brief No. 489. Washington, DC: EBRI, August 2019. Estimates $92.4 billion annual 401(k) leakage and projects $1.5–2.0 trillion in preserved savings from broad auto-portability adoption.
EBRI / ICI 401(k) Database. Year-End 2023 Data Release. Covers 27.1 million participants in 110,794 plans. Primary source for 401(k) median balances and long-tenure participant averages. https://www.ebri.org and https://www.ici.org.
Investment Company Institute (ICI). ICI Research Perspective: 401(k) Plan Asset Allocation, Account Balances, and Loan Activity. Washington, DC: ICI, April 2026. https://www.ici.org/statistical-report/ret_26_q4.
Alight Solutions. “Distributions from Retirement Plans After Employment.” 2019. https://www.alight.com. Documents cash-out rates: 80% for balances under $1,000; ~65% for $1,000–$5,000; 2% for $250,000 or more.
Vanguard. How America Saves 2025. Valley Forge, PA: The Vanguard Group, June 2025. https://institutional.vanguard.com/how-america-saves.
KFF (Kaiser Family Foundation). Employer Health Benefits Survey, 2023–2024. https://www.kff.org/health-costs/report/2024-employer-health-benefits-survey. Source for large-employer retiree health coverage (24% in 2024, down from 66% in 1988).
Pension Rights Center. Retirement Plan Coverage Data, 2024. https://www.pensionrights.org. Source for share of retirees receiving private DB annuity income.
Pew Charitable Trusts. Saver’s Match Eligibility Analysis. 2024. https://www.pewtrusts.org. Source for estimate that 22 million Americans will qualify for the Saver’s Match.
Morningstar. “SECURE 2.0 Saver’s Match: Projected Impact.” 2024. Source for projection of $2.03 trillion in incremental 40-year retirement savings benefit from the Saver’s Match.
Moore, James H., Jr. and Leslie A. Muller. “An Analysis of Lump-Sum Pension Distribution Recipients.” Monthly Labor Review (Bureau of Labor Statistics), May 2002. https://www.bls.gov/opub/mlr/2002/05/art3full.pdf.
Burman, Leonard E., Norma B. Coe, and William G. Gale. “What Happens When You Show Them the Money? Lump Sum Distributions, Retirement Income Security, and Public Policy.” Brookings Institution, January 2001. Estimated pre-retirement cash-outs reduce annual retirement income by $1,000–$3,000 per incident.
Adequacy Diagnostic Studies (Methodological Spectrum)
National Institute on Retirement Security (NIRS). The Continuing Retirement Savings Crisis. Washington, DC: NIRS, 2015. Finds 92% of households below retirement savings targets using account balances only, excluding home equity. https://www.nirsonline.org.
Munnell, Alicia H., Wenliang Hou, and Geoffrey T. Sanzenbacher. “National Retirement Risk Index: An Update.” Center for Retirement Research at Boston College, Issue Brief. Boston: CRR, updated annually. Deterministic model finding ~50% of households at risk; assumes constant pre-retirement lifestyle without household downsizing adjustment. https://crr.bc.edu.
Hurd, Michael D. and Susann Rohwedder. “Economic Preparation for Retirement.” NBER Working Paper No. 17203. Cambridge, MA: National Bureau of Economic Research, July 2011. https://www.nber.org/papers/w17203. Using actual post-retirement consumption data rather than income-replacement targets, finds 81% of households managing adequately in retirement.
Aon Hewitt. “The Real Deal: 2012 Retirement Income Adequacy at Large Companies.” Lincolnshire, IL: Aon Hewitt, 2012. Stochastic simulation study finding approximately 60% of full-career workers adequately prepared when full-career employer plan participation is included.
Elder Economic Security Standard™ Index (Elder Index / EESI). Wider Opportunities for Women (WOW) / Gerontology Institute, University of Massachusetts Boston. Measures the actual cost of basic needs for older adults at approximately twice the Federal Poverty Level. https://elderindex.org.
Behavioral Economics — Annuity Puzzle and Sequence of Returns
Yaari, Menahem E. “Uncertain Lifetime, Life Insurance, and the Theory of the Consumer.” Review of Economic Studies 32(2): 137–150, 1965. Foundational formalization of the annuity puzzle.
Brown, Jeffrey R., Olivia S. Mitchell, James M. Poterba, and Mark J. Warshawsky. The Role of Annuity Markets in Financing Retirement. Cambridge, MA: MIT Press, 2001. Extended empirical documentation of the annuity puzzle and its determinants.
Benartzi, Shlomo and Richard H. Thaler. “Heuristics and Biases in Retirement Savings Behavior.” Journal of Economic Perspectives 21(3): 81–104, 2007. Documents present bias, loss aversion, and status quo bias as drivers of suboptimal distribution decisions.
Thaler, Richard H. and Cass R. Sunstein. Nudge: Improving Decisions About Health, Wealth, and Happiness. New Haven, CT: Yale University Press, 2008. Foundational framework for behavioral design and default-based interventions in retirement savings.
Pfau, Wade D. “Sequence of Returns Risk in Retirement.” Journal of Financial Planning and various working papers. Documents how the order of investment returns—not just the average—determines retirement portfolio longevity when withdrawals are active; early crashes force outsized liquidations at market bottoms, permanently destroying future compounding.
Author’s Prior Work
Salisbury, Dallas L. “ERISA at 30: Where Is the Employer-Sponsored System Going?” Keynote to the 2004 American Bar Association Joint Committee on Employee Benefits Symposium, April 14, 2004. The predecessor paper to the present analysis.
Salisbury, Dallas L. “Will We Outlive Our Money?” Benefits Quarterly, Fourth Quarter 2000, pp. 31–36. Analysis of longevity risk and the transition from annuity-based to account-ba


May 1, 2026
Comment
Implementing the Guiding and Establishing National Innovation for U.S. Stablecoins Act for the Issuance of Stablecoins by Entities Subject to the Jurisdiction of the Office of the Comptroller of the Currency